
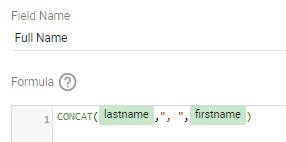
CONCAT is a fabulous function in Looker Studio, since it allows you to combine information efficiently in a calculated field. A simple example: if you have lastname and firstname fields in your data, you can combine them to create a Full Name calculated field as shown here (example output would be Smith, John.)
However, I recently learned that "\n" (newline escape character) can also be incorporated into a CONCAT field to include a line break in the resulting calculated field. This can be SUPER useful if you're trying to cut down on the width of a table so it fits better on your dashboard.
Originally, this table had one column for each field, so the table needed to be relatively wide.
After some creative CONCAT, including "\n", the table takes up much less horizontal real estate. Note that the table needs to have text wrap turned on in order for this to work.
After some creative CONCAT, including "\n", the table takes up much less horizontal real estate. Note that the table needs to have text wrap turned on in order for this to work.

The drop-down filters elsewhere in this report can still be used to filter records based on the individual fields (like Department), although one caveat is that the table can't no longer be sorted by Department with this approach (not a big deal in this case).
In this example, the (chart-level) calculated fields looked like this:


This approach also works well for the Tooltip on a bubble map, allowing you to bring lots of information into your Tooltip without the rollover label becoming too lengthy and running off the side of the report. (Side note: I have not been successful using this approach on a scatter plot, however.)
If you have additional ideas on how to use this type of line break in Looker Studio, let me know!

 Filter Controls are elements that can be added to any Data Studio report, using the Filter Control button in the toolbar. The default Filter Control is a multi-select pop-up type, but it can be configured in the Style pane with a number of options. Filter Controls can be single-select or multi-select, can include a Search box, can be a pop-up or clickable type, and can include filter operators such as EQUALS or CONTAINS. Of course, color, font, and size are all customizeable as well.